 In honor of All Hallows’ Eve, I relay this tale of woe and warning about a Multivariate marketing experiment that was doomed, doomed from the start! Read and retain, lest ye tumble into the same pitfalls and traps in your Optimization work.
Why was this test so “spooked,” you ask? Because it took too long to run, and it only reached 74% confidence before we decided to give up on it! Boo! (Hoo)
There’s nothing wrong with a test that produces “negative lift,” but we should all shudder to read about a test that failed to reach confidence quickly, and only provided “directional” business insights 🙁
This experiment was haunted by a few characteristics. If you can fight back against them, you can probably stay safe this Halloween and beyond.
1) Scope creep(y)
One of the quickest ways to ruin a marketing experiment, especially a multivariate (MVT) style test, is to allow the scope of the test to creep too large. This particular test started off as a relatively small array of factors. Certain stakeholders wouldn’t stand for this, and injected the poison of many more elements into the test and hypothesis. They tried to “boil the ocean” with a single test instead of relying on multiple, iterative test rounds.
Stay Safe This Halloween: Beware of zombie-stakeholders who don’t understand the mechanics of testing and statistical analysis. They don’t realize that bloating a test with more ideas will simply break it or slow it waaaay down. Push back on them with data-backed statements and alternate options. Let them know that you have their bloodthirsty interests in mind, and will help them answer their marketing questions…your way.
2) Ghostly Isolations
An “isolation” in testing jargon refers to an “isolated variable” where a relatively small change is made and all other variables are held constant to ‘isolate’ the change and fully understand its pure effect on conversion rate.
This test had two isolated variables built into the design, again based on zombie-stakeholder requests that should’ve been respectfully shut down with the garlic, wooden stakes, and silver bullets of testing expertise.
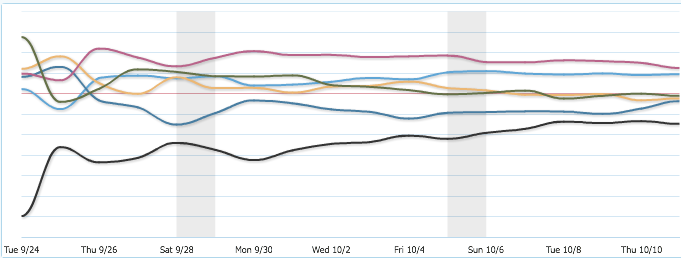
 The desire to isolate variables is fine, but the ones in this test were too subtle, meaning the changes weren’t different enough from each other. In the trend line above, you’ll see that the tested levels, including isolations, all outperformed the Control, but in the end they “clumped” together making it far more difficult for the testing tool to reach 95% or higher confidence.
Stay Safe This Halloween: If you’re going to do isolations, make them BIG and radical if possible, and/or have a graveyard full of traffic to throw into the test. An ideal big isolation would be the hiding and showing of a page element, by the way.
3) Marketing Changes “In the Wild”
One of the major threats to the validity of marketing experiments is changes in the audience sample due to new marketing campaigns, changes in PPC ad spend, press releases, and other marketing events out “in the wild.”
While the participants in a website experiment will never be constant or “normalized,” it is a best practice to minimize change during the run of an experiment to prevent weirdness in the data that might skew test results.
In the case of this haunted experiment, we saw the influence of a factor within the multivariate array go one direction, then reversed for about a week, then went back to the previous influence. While this may actually have been a case where the data was cursed, it’s more likely that something influenced by the Marketing organization skewed the data for a period of time.

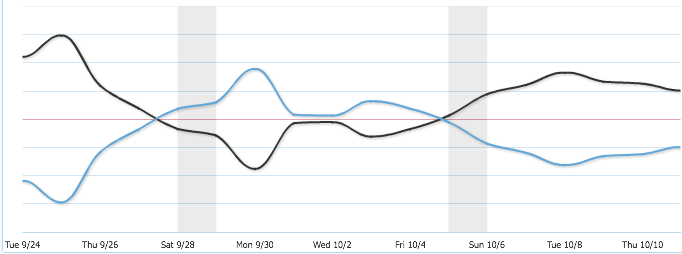
The theory that something changed about the experiment’s sample population during the test run is backed by what we saw in the overall traffic trend over the duration of the test.
It’s pretty obvious that the trend of overall traffic entered into the experiment was on the rise. While weekends were lower than weekdays, the work-week trend line continued up week-over-week. This is not the relatively stable trend line you want in an experiment.
Whether this upward trend of traffic was due to an email blast, a TV campaign, or a change in PPC advertising tactics, the result is the same: unwanted variables were introduced into the experiment, and the data was skewed (or at least confused). This “confusion” in the data caused the test to not reach 95% or higher confidence.
Stay Safe This Halloween: Whenever possible, defer major changes in Marketing tactics until after your experiment has run. If these shifts can’t be avoided, it’s at least good to be informed about them so you can interpret trends in the data instead of scratch your head!
Hope you enjoyed this creepy tale of the “dark side” of website testing. For more Optimization-meets-the-macabe, head over to the WiderFunnel blog for more digital marketing horror stories.
