Are Your Digital Experiences 2017…But Your Forms 2007?

[Originally published September 16th, 2008 on GrokDotCom.com, an award-winning, but now defunct, Marketing Optimization blog.]

I was recently reminded, for the millionth time it seems, that forms are the “bread and butter” of almost every website, app, and digital experience. Whether it’s the Contact Us form on a B2B site, the Sign Up form on a social networking site, or the Checkout of an eCommerce site, they all have forms in common. And in every case, forms are what stands between our site visitors and the action we’ve persuaded them to take.

The irony is that companies spend thousands, sometimes millions, on making their sites functional, accessible, usable, intuitive, and sometimes even persuasive, but don’t always spend enough on making their transactional experiences (forms) as optimized as possible. Add to that the money spent starting a relationship with customers via online or offline marketing. And when it’s time to take that relationship the next level and close the deal, online forms have the responsibility.

So like the title of this post, I have questions:

  • How much have you spent on your homepage and landing pages in the last 12 months? (Design, UX, Content, etc.)
  • How much have you spent on your forms?
  • How many resources work on your homepage and landing pages? (Design, UX, Content, etc.)
  • How many resources work on your forms?
  • Do you A/B and Multivariate test your homepage and landing pages?
  • Do you A/B and Multivariate test your forms?
  • Do your homepage and landing pages employ the latest technology, code, and standards?
  • Do your forms…?

If you’re like most companies and marketing organizations, and answered honestly, there was a heavy skew towards focusing on digital experiences, yet oddly little focus on forms, the places where the “rubber meets the road.”

Of course homepages and landing pages are important, and deserve lots of attention. But don’t forget that the bottom of your conversion funnel is where all the serious action is. It’s where dollars either flow into your bank account or…elsewhere.

So what can you do to start to rebalance the focus and give your forms more love?

  1. Start a “Forms Task Force” within your company–make it cross-disciplinary–and take a good, hard look at your forms.
  2. Conduct User Tests that prompt interaction with your forms.
  3. Look at every question on your forms. To paraphrase Web Form Design by Luke Wroblewski, consciously decide to “keep,” “cut,” “postpone,” or “explain” every question you ask your customers.
  4. Once you’ve revisited your forms, begin (or revitalize) the ongoing process of form testing and optimization.

Don’t Dismiss the Base Hits

[Originally published September 3rd, 2008 on GrokDotCom.com, an award-winning, but now defunct, Marketing Optimization blog.]

Readers of my blog, and especially those involved in testing, know that conversion rate optimization is the goal we’re after. It’s a great feeling to know that a test you worked on increased conversion or some other KPI, especially when it’s a “Home Run.” I define Home Runs as triple-digit increases in conversion rate.

But one of the dangers of early testing efforts is the problem that some baseball players have: “swinging for the fences.” (Apologies for the baseball references, but it’s getting to be that time of year.) What if your test, or series of tests, doesn’t appear to raise conversion rate? Do you dismiss the tests as failures because they’re not home runs?

Of course not!

Worst case scenario is that you’ve learned something about executing meaningful tests, and about what does or doesn’t resonate with your customers. But more often than not, you are affecting your website in more subtle ways. Remember that conversion rate is often a blended, averaged, blunt instrument. Especially when it’s averaged across large volumes of organic search traffic, SEM traffic, email house list traffic, different product lines, etc.

Here are some things you can monitor when your tests aren’t having huge impacts on your overall conversion rate:

  1. Micro-conversion rates – If you’re testing product detail page layouts and “Add to Cart” buttons, check if those test variables are having an effect on the micro-conversion rate of adding products to the cart.
  2. Funnel conversion rates – If you’re testing lots of minor copy changes to your shopping cart, check for changes in your funnel conversion rate.
  3. Bounce rates – If you’re testing images, copy, or other changes designed to build up the credibility of your site, watch for changes in bounce rates.
  4. Conversion rate by segment – If a key traffic source’s conversion rate goes up in a test, but is “averaged down” by other less important traffic sources, that may in fact be a successful test.

These types of incremental improvements are test results to get excited about! If your micro-conversion rate increases, and your funnel conversion rate stays the same, that’s still more money in your bank account. If you reduce the bounce rate, you’ve gained the chance to convert that customer later, instead of your competitor.

So don’t dismiss the base hits because you’re disappointed about not hitting a home run (this time.) Take it from a patient analyst who’s favorite baseball player was famous for lots of base hits and not all that many home runs 🙂

Information Overload: Why Less is the New More

[Originally published June 24th, 2008 on GrokDotCom.com, an award-winning, but now defunct, Marketing Optimization blog.]

A new report entitled Information Overload: We Have Met the Enemy and He Is Us was written up recently in the Wall Street Journal and the New York Times. Commissioned by Basex, it details how information overload, particularly task interruptions, costs the Enterprise $650 billion a year in lost productivity.

That’s a very large price to pay for having everything at our fingertips, all the time, in any format.

Our decision-making processes can’t always keep up with our choices. The same challenge applies to website design and content. The Web is a fantastic place to shop, research, and be entertained, but sometimes when I’m online, I notice physical fatigue when I’m trying to figure out where to go next!

When I’m evaluating a vendor’s Services page, should I:

  • Sign up for their newsletter?
  • Read about the awards they’ve won?
  • Look at a list of clients?
  • Read the CEO’s blog?

When I’m shopping for a health supplement, should I:

  • Read about related products?
  • Read about their latest “green” program?
  • View my empty shopping cart?
  • Become an affiliate?

Even though we come to a website with the best intentions, we’re by nature drawn to the shiny distractions that marketers and designers put along our path. We go down rabbit holes in websites and sometimes by the time we find our way back to the trail, we’ve lost our momentum . . . or maybe we’ve been interrupted and have to go back to work 😉

So I’m wondering: How much money is lost each year because we overload our potential customers with information on our web pages? How many visitors are driven away by cluttered designs, too many messages, too many offers, and too many choices?

Here’s the problem: Marketers naturally want to use messaging, offers, promotions and more to persuade web visitors. But in their efforts, they often contribute to information overload, which is proven to hamper the decision-making process. Also, companies tend to add more content to their websites over time and rarely retire content that’s outdated or irrelevant.

The solution: Most web pages should have only one primary goal. If there are alternate options, offers, or next steps, that’s fine. But don’t interrupt the task at hand, and don’t overload your visitors with distractions.

The one exception I can think of is the homepage, which should, at a minimum, a) communicate Unique Value Proposition, and b) route visitors.

Should you remove these secondary goals and choices? Maybe, but sometimes making them less prominent is enough to move the needle. It comes down to a business decision whether your “Sizzlin’ Hot Summer Giveaway” promotion is worth distracting a certain percentage of visitors from their primary goal.

What if you don’t know the goal of all of your site’s pages? You could start with rediscovering who your customers really are, or some analysis of your website’s “data dump,” or you could hypothesize and run some tests. Sometimes the purpose of a page is simply to present options. That’s fine, but don’t distract visitors from understanding their options and making a decision.

So let’s get practical here:

  • Category page primary goal = route visitors to sub-category or product page
  • Product page primary goal = persuade visitors to purchase
  • In the News page primary goal = build brand credibility
  • Shopping cart page primary goal = get the cash!
  • General content page primary goal = build persuasive momentum

Although it seems hard at first, it’s actually pretty easy to find a single, primary goal for most pages on your site. Then you have the harder task of deciding how to do away with unnecessary distractions, get rid of design clutter, and allow visitors freedom without information overload.

Sometimes having a new pair of eyes look at your site can really speed this process up.

If you’re overloading customers with info, you’re not alone. Many world-class, million-dollar sites are guilty of information overload, and even the best online marketers need to work on it constantly.

Best of luck. To avoid information overload, let’s focus on answering three essential questions of site Optimization:

  • Who is your visitor?
  • What action do you want them to take?
  • What will persuade them to take that action?

Cross-post: What Does Your SaaS Welcome Packet Look Like?

I explore the concept of a new customer “welcome packet” in the offline and digital worlds: https://www.linkedin.com/pulse/what-does-your-saas-welcome-packet-look-like-brendan-regan

9 Reasons Your Conversion Rate Fluctuates

conversion rate trend lineAs a practitioner of Web Analytics and Optimization, I’ve spent a fair amount of the last seven years of my career focused on tracking and improving Conversion Rates.This is a noble pursuit for any business, but intense focus on the conversion rate metric can have negative implications – people in your organization (or your clients) may obsess about changes in conversion rate, pester you about them, and even blame you for them!
To avoid this risk and/or annoyance, it helps to have simple, educational “sound bites” for stakeholders explaining why they are maybe/possibly freaking out for no good reason. This is NOT to say that you shouldn’t diligently investigate what you believe to be causes for concern to your business or client, however. Strike a balance, as in all things.

Let’s say someone in your company comes to you with some data about a change in conversion rate. That is a good thing (coming to you with data), right? So, first off, don’t brush them off. Encourage data-driven behavior, even when it might be off-base!

They’re concerned because in a week-over-week report, conversion rate has dropped by 25%. That’s usually a bad thing, so it’s worth some respectful, diligent investigation. Assuming you’ve looked at various data points, and are of the opinion that it’s not a cause for immediate concern, here’s how you might frame the conversation as it continues.

Hi, [Stakeholder], thanks for bringing this to my attention. I’ve dug into the data, looking at YoY behavior, key segments, etc. and I recommend we take a “wait and see” approach. I’m attaching a trended report, so you can see beyond the week-over-week view.

The Stakeholder will almost inevitably ask some follow-up questions about why conversion rate is down. While you will likely have some data points and explanation of your own, here are 9 of my favorite reminders of why your conversion rate may fluctuate from time to time, instead of the constant “up and to the right” trend that we all strive for: Continue reading

The Very, Very Inspiring “DIKW” Hierarchy

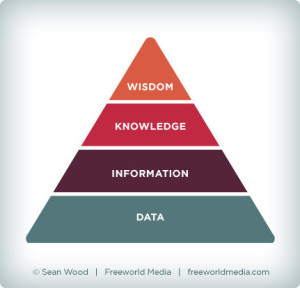
D I K W hierarchy

Image credit: Sean Wood

I want to discuss a framework that’s new to me, but not that new: It’s called the Data > Information > Knowledge > Wisdom Hierarchy, or the “DIKW Pyramid.”

I was turned on to it very recently, but it’s been around since at least 1982. It, or variants of it, have been used in fields as diverse as Information Science, Engineering, and Geography.

Different academics in different fields of study seem to disagree about how useful or smart the framework is, but I’ve been thinking about DIKW in terms of Web Analytics and Optimization (natch). And, it’s working just fine for me! 🙂

This framework helps explain the kinds of work I’ve been focused on for the last 10 years or so in Digital Marketing. Kindly allow me to explain…

Continue reading

Video Podcast on Optimization Testing Hypotheses

marketing optimization podcast series logoHi Readers! I’ve not been posting lately, which is sad. I’ll try to get back on the horse in 2014 😉

What I have been up to is a fun video interview and podcast with Alex Harris of the Marketing Optimization podcast series. In it, we discuss my framework of the 5 ingredients of a world-class testing hypothesis. Better yet, we do live optimization on landing page designs, showing you how to use the framework on your site pages!

Check out the session here »


And, if you’re the podcast-listening sort, make sure to subscribe to the Marketing Optimization podcast on iTunes, which features a new podcast with a digital marketing expert every week!